Read Time: 3 minutes
Article Summary:
- I was hired at a management consulting firm to assist with administrative duties.
- I took the self-initiative to create an Excel template that cut processing time from 20 to 5 minutes per report using nested functions and Power Query.
- I learned some basic principles of data analytics by addressing a business problem and being curious.
Related Article - Credit Union Internship: No Experience to Exec-Level Dashboard
In this story, I will cover
- Why I Interned at Metamorphosis Consulting
- How I Reduced Processing Time by 75%
- What I Would Do Differently
- What I Learned
Why I Interned at Metamorphosis Consulting
It was the summer of 2020, and I had just been sent home to Vero Beach, FL ¼ of the way through the second semester of my freshman year at the University of Florida following the outbreak of the COVID-19 global pandemic.
As a freshly declared business major, I was overwhelmed by the number of career options that I had to choose from. Fortunately, I connected with Joeseph McAuliffe, owner of a local management consulting firm of about 3 employees named Metamorphosis Consulting, via cold email.
Metamorphosis Consulting advises real estate agents on how to secure new clients, manage their listings, and much more. McAuliffe offered me the opportunity to perform administrative duties such as scanning files, creating PowerPoint presentations, and compiling market reports.
How I Reduced Processing Time by 75%
About the Market Reports

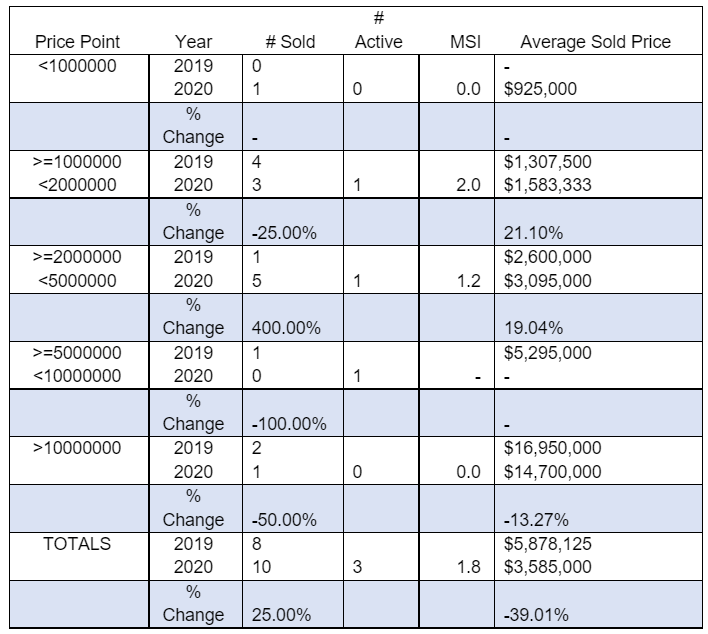
An example of a market report is shown above. These reports were accompanied by the client’s contact information and used as online and print advertisements.
The reports recorded the aggregate number of homes sold, active listings, monthly inventory, and sale price year-to-date (YTD) for the current and previous year, grouped by custom price ranges. These reports were generated each quarter for about 30 different geographic regions in Florida with separate reports for each home type, including single family homes and condos.
Each region’s data is sourced from its respective Multiple Listing Service (MLS) website. The MLS had very limited aggregating capabilities, so almost every calculation had to be generated individually by filling out the matrix pictured below:

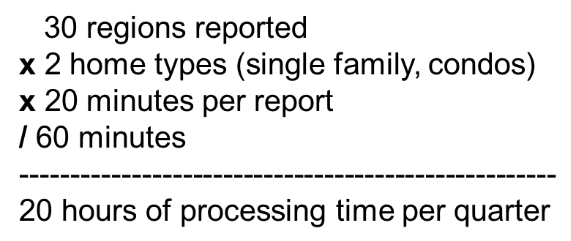
While only the highlighted fields needed to be filled out, this process was very tedious. I timed myself using this technique, and it took 20 minutes to generate a single report. I estimated that it took 20 hours per quarter to complete all required reports, a heavy burden on the company’s 1 executive assistant.

My Solution
My solution to this issue was to create an Excel template which would automatically aggregate the required calculations with customizable date and time ranges. The template would pull from data exported from the MLS website. The following is an example of the final report which was then passed on to the company’s graphic designer.

Preparing the Data
Due to the MLS website’s export limits, the data had to be filtered and exported by sections. For each region and home type, I exported all sold and active/current listings from the past 2 years YTD. This method reduced filling out the matrix from 18 times per report to once per report.
In the template file, I imported the data by creating a connection to the export file. I then cleaned the data using Power Query so that it would be easier to work with using functions. This included manipulating date types and truncating values. The final data source looked similar to this:

Using Functions to Create the Excel Template
A copy of the template with a sample data set can be viewed here (the sample provided is from a small region for demonstration purposes).
I used COUNTIFS() and AVERAGEIFS() to filter and aggregate the data by sold or active status, price ranges, and year. The template is set up so that the user only needs to input the desired year and price ranges once to update the entire report as indicated by the dependency arrows seen in the image below:

The Outcome
This template allows the user to generate the market report for a given region by simply exporting 2 data sets and cleaning them rather than filling out a matrix 36 times per region and manually transferring each individual number to a spreadsheet. This resulted in processing time being cut from 20 minutes to 5 minutes per report
Limitations
Due to the MLS website’s export limit and inability to connect to a live data source, this revised method still involves a some tedious manual data extraction and manipulation. This is time consuming, prone to human error, and can appear senseless to someone who lacks experience in Excel. However, it is still a great improvement upon the previous method.
What I Would Do Differently
In retrospect, I would have begun this project by searching for an Application Program Interface (API) to the MLS website. An API would have enabled me to connect to the MLS database directly from Excel.
Additionally, I would have used Pivot Tables instead of functions. With Pivot Tables, the user would only need to export the data, add the appropriate fields to a Pivot Table, and group the aggregations by price ranges with a simple right click.
Pivot Tables would replace the use of functions and Power Query with simple drag-and-drop procedures. They would also eliminate the need to store an export file for each region and a template file.
What I Learned
Technical Skills
- Principles of Data Aggregation and Preparation
- Importing Data in Excel
- Nested Functions
- Excel Power Query
- Intro to SQL (self study)
Lessons Learned
“Start with the business problem. Think creatively. Know how to ask the right questions.”
→ The most effective way to gain technical skills is to start with the business problem, think creatively, and know how to ask the right questions.
→ Taking the initiative to solve a problem, even if you feel underqualified, can pay off big time.
→ Always look for ways to make an impact.
Read about how I applied what I learned at Metamorphosis to myinternship at Navy Federal Credit Union where I went from zero PowerBI experience to creating a dashboard for my division’s VP.
